


Click here to view the Quick Start Guide in pdf form and save it on your computer.
Click here to view the Reference Manual in pdf form and save it on your computer..
EASy Quick Start
Your Users Guide to
Pelagic Habitat Analysis Module
Software for the Study and Management of Pelagic Species
Table of Contents
Using PHAM Quick Start
PHAM Quick Start is a simple, easy to use guide to get you started in PHAM. The detailed instructions, answers to frequently asked questions, examples, and common mishaps make it even easier to learn and use PHAM. In addition, there are links on each page to even more information for the advanced user! Step-By-Step |
|
1.Using the Table of Contents, 2. Follow the "Step-By-Step" Instructions 3. Read through the Frequently Asked |
4. Make sure to avoid the common mishaps 5. Check out the Reference Manual cited by Appendix Letter |
 |
Where can I download The Reference Manual can What if the information in Please check the User Forum |
Skimming: Please read the Quick Doing without understanding: |

For more information, see Reference Manual Appendix A: PHAM Basics
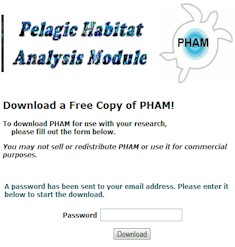
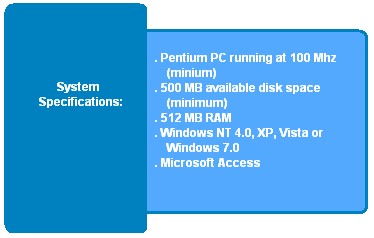
Installing PHAM
PHAM provides researchers with the tools to examine data in a 4 dimensional context – latitudinal, longitudinal, vertical, and temporal (Ref Manual Appendix A). This unique GIS program contains an interface for satellite imagery products from NASA and others. PHAM runs on Windows Operating Systems. Step-By-Step |
|
1. Select Download Program from the menu.
4. A temporary password will be sent to |
5. Change the temporary password |
For more information, see Reference Manual Appendix A: PHAM Basics
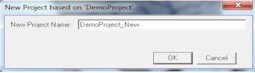
Creating a New Project
Whenever you start a new study, you will want to start a new project as well. By creating a new project, your work is kept organized with a new subdirectory complete with a separate database designated to your next study. The folder and database created will have the same name that you give your project. Step-By-Step |
|||||
|
3. Type in the name of your new project and click Ok. | ||||
|
 |
||||
|
Can I keep imagery from Yes. If you would like to use the Can I use symbols You can use any symbol except |
Unoriginal project naming Using the same name as |
For more information, see Reference Manual Appendix A: PHAM Basics
Editing Map Display
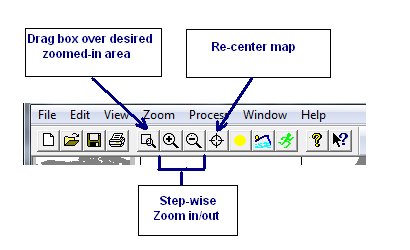
The following steps guide you through changing the zoom, projection, grid lines, grid labels, and the units of the map. PHAM has options to change the extents of the map as well as the grid lines and projection type. Step-By-Step 1. To change the screen extents or map center, use the buttons on the main toolbar (Ref Manual Appendix E.1).
|
|
2. To change any other map options go to View in the main menu. Then click on Display Settings. 3. Once in Display Settings, click on the Settings tab. 4. To change the projection, choose the projection type from the Projection drop down menu 5. To turn grid lines/labels on or off, check or uncheck the box next to Grid Lines or Grid Labels 6. To change the units of the map, click select from the Distance drop down menu and the Lat/Lon drop down menu. |
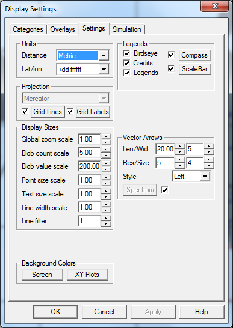 |
For more information, see Reference Manual Appendix B.1.1: Map Settings
Importing Data
PHAM is equipped with an easy to use database wizard that imports your data and stores it in the project database. Following the steps is very simple, but make sure you look at the appendix on this one! Understanding the data fields is essential to analyzing your data properly in PHAM. Step-By-Step
|
|
|
|
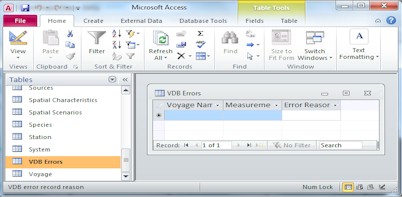
If not all your data was imported successfully… - Choose Edit-Project Database. - Select the VDB Errors table from the side panel. Scroll to the Error Reason column to see why your data were not imported. - Fix errors in data file. - Repeat Steps 2-3. |
 |
|
Can I leave any data Station, sample, and voyage |
What type of characters Voyage, Station, Sample, Units, |
|
|
Duplicate Records: PHAM will not accept Invalid Dates: PHAM accepts dates in the Incomplete Records: Every record must |
Different Locations, but Same Station Name: Poor Planning: Take the time to |
For more information, see Reference Manual Appendix C: Understanding the Data Fields
Displaying Data Blobs
Once the data has been imported into PHAM, it can be displayed as circles, filled in dots, or pies. The value placed on each station can be a count, sum, average or presence/absence. As always the steps below will help guide you through the process, but be sure to consult the references if you lose your way. Step-By-Step
|
|
1. Within PHAM, select View-Display Graphics
|
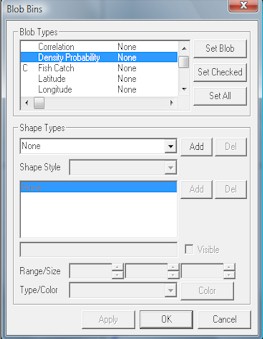
To Define Scaling of Blobs, Select the "Shape" Box. - Click on the Measurement Name in the Blobs Type box (see above). - Select a Shape Type from the drop down box and choose Add. This adds a bin for the measurement type. - Specify the Range value, Size and Color for the bin. - Click the box directly to the left of the left of the blob type name to make the respective bin visible on the map. |
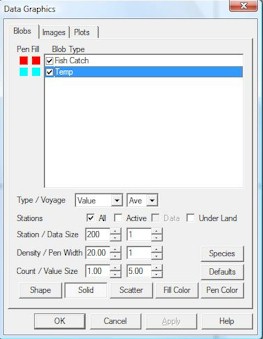
For more information, see Reference Manual Appendix C.3: Data Graphics
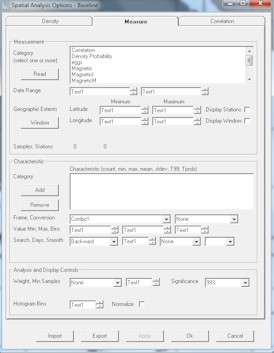
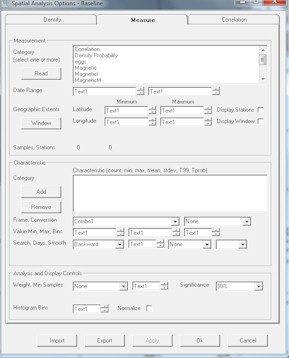
Spatial Analysis
The Spatial Analysis tool allows you to match up your data with imagery. Within this tool you can look at correlations between your data and the imagery and export the matched data to a csv file. Step-By-Step
|
|
1. Select View-Spatial Analysis Options.
|
For Density & Correlation Plots: - The Density tab governs what variables appear in the Sample Density Plot. - The Correlation tab governs what variables appear in the Characteristic Distribution / Correlation Plot. You can choose to plot this as a false color image, with confidence intervals, and/or on a reverse axis. |
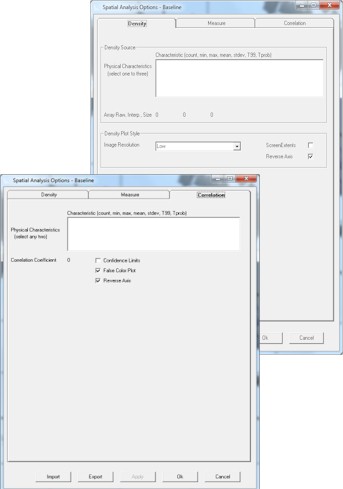
For more information, see Reference Manual Appendix E: Spatial Analysis
Importing Imagery
After your measurements have been loaded into your project, you'll want to get the environmental data that correspond to your dataset. Satellite imagery is available in more formats than there are sources. PHAM has the ability to read many of these imagery formats. Beginners should start with the imagery available on the imagery page. If you want to try your own imagery, be sure to read Appendix D. Step-By-Step
|
|
1. Browse to the imagery page on the website. |
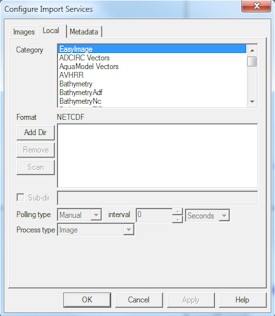 |
For more information, see Reference Manual Appendix D.1: Import
Displaying Imagery
These steps will guide you through browsing through images and setting up a scale for your imagery set. Step-By-Step
|
|
|
|
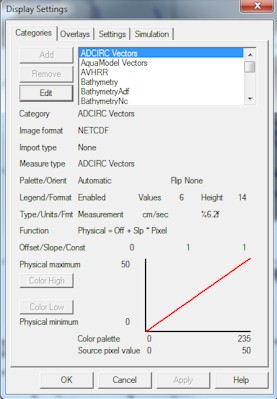
Displaying Imagery - Changing Palettes:
These steps will guide you through changing the palette for your imagery. Step-By-Step
|
||
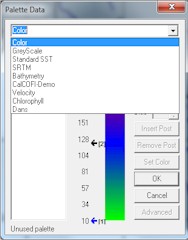
1. With an imagery set displayed on the screen, right click anywhere on the map and select Palette. 2. The top drop down box contains a list of pre-set palettes for the different imagery types. To try one of these simply click on the name of the palette and click Ok. 3.If none of the pre-set palettes work, use the advance options to create your own palette. Doing this ensures that the pre-set palettes remain unchanged. |
||
 |
 |
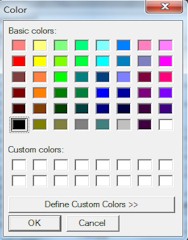 |
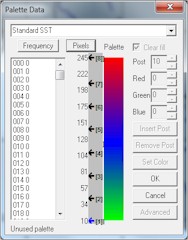
4. Click on the black arrows, continue holding down while you move the arrow up or down along the scale. 5. To change the color of the post, simply double click on the arrow and select the new color box. Then click Ok. 6. The values on the side of the colorbar can be set to read either the pixel value or the physical value by toggling the Pixels or Units button at the top of the color bar. |
||
For more information, see Reference Manual Appendix D.2.1: Palette
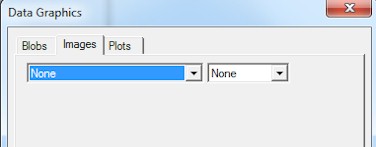
Creating Plots
With PHAM, you have the ability to create interactive plots of the data and imagery by following the simple steps below. Step-By-Step
|
1. Within PHAM, select View-Data Graphics |
|
Basics on the Plots Available:
|
|
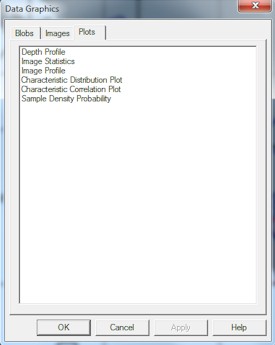
For more information, see Reference Manual Appendix C.2.3: Plots
Running Simulations
Simulations are videos of the data and/or an imagery set through time. Step-By-Step
|
|
1. Select View-Display Settings.
|
|
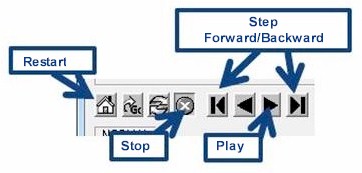
7. Select Process-Simulation Controls. |
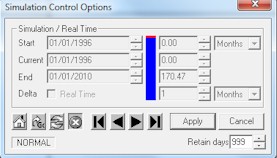 |
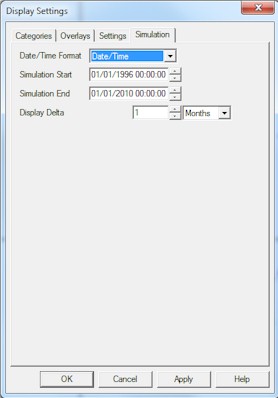
For more information, see Reference Manual Appendix D.2.3: Simulations
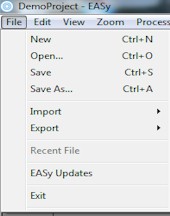
Exporting Data & Maps
One of the greatest things about PHAM is its compatibility with the programs most scientists already use. All data and maps generated in PHAM can be exported in a variety of formats simply by following these steps. Step-By-Step
|
|
For Data1. Select View-Spatial Analysis Options. |
|
|
|
|
For Maps1. Select File-Export-View |
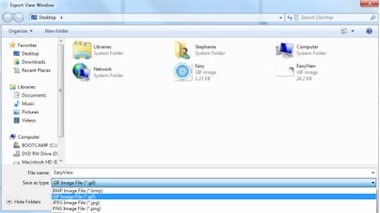
For more information, see Reference Manual Appendix A.4: Export Capabilities


