

About PHAM
 The Pelagic Habitat Analysis Module (PHAM) is a set of software tools designed to assist fisheries managers, scientists, and researchers to examine and predict the habitat for pelagic ocean biota utilising presence/absence or abundance data for the biota combined with environmental datasets such as satellite imagery, bathymetry, survey cruises, and ocean currents.
The software resides within the Environmental Analysis System (EASy) Geographic Information System (GIS) that is developed by System Science Applications, Inc., specifically for marine applications. The EASy GIS provides a 4 dimensional home for marine data (Latitude, Longitude, Depth, and Time) within its integrated Excel and Access databases.
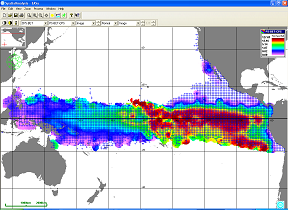
In the PHAM project, the GIS is home to both data on the subject marine species as well as environmental parameters to be investigated in defining the pelagic habitat of that species. Data for the subject species can include fishing fleet catch and effort, electronic and conventional tagging data, fisheries survey data, recreational logbook data, and other forms of data relevant to location and/or abundance of the biota. Environmental data can be imported from various sources including satellite remote sensed data of which more than 100 formats are currently supported in EASy, as well as output from ocean circulation models such as the NASA ECCO2 Global Circulation Model, or various implementations of the Regional Ocean Model (ROMS).
The power of PHAM’s capability is the ability to match biota data with environmental data by providing user friendly tools to sample the environmental data sets at the location and time of biota data points. This allows a matrix of associated data to be constructed, which can be subsequently used for research, statistical analysis, model development, fisheries management, and habitat mapping and prediction. PHAM provides tools to assist with all of the above as well as the ability to export data for further analysis in dedicated statistics or other scientific software. Results can then often be re-imported to PHAM for display with the multitude of EASy GIS visualisation tools.
PHAM was developed by a team of scientists, engineers, and software developers from System Science Applications, Inc. the University of Southern California, the University of Sydney, the NASA Jet Propulsion Laboratory, The Inter American Tropical Tuna Commission, and the Coastal Pelagics Division of the NOAA Southwest Fisheries Science Center. This work is funded by a grant from NASA.
For further reading on the development, science, and some applications of PHAM please see the publications page. Further information about the EASy GIS can be found at www.runeasy.org.